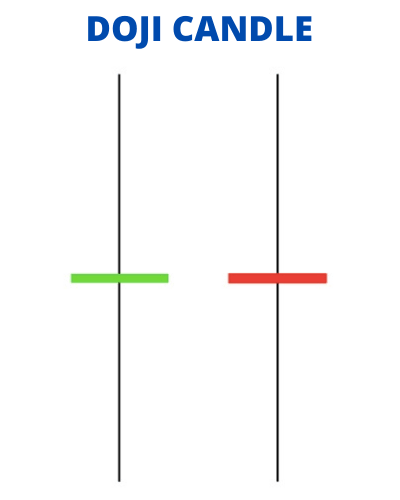
In technical analysis, a Doji candlestick pattern is a significant signal that occurs when the opening and closing price of an asset is almost the same. The candlestick body is very small, and there are usually long wicks or shadows on both sides, indicating indecision or a standoff between buyers and sellers. Here are some possible psychological explanations for the Doji candlestick pattern:
Indecision: A Doji candlestick pattern suggests that there is a lack of conviction from buyers and sellers. This could be due to uncertainty or conflicting information in the market. It indicates that the market is in a state of indecision and could move in either direction.
Balance of power: The Doji candlestick pattern represents a balance of power between buyers and sellers. Both sides are unable to gain the upper hand, resulting in a standoff. This balance of power often leads to a reversal in the trend, but it can also lead to a continuation of the current trend.
Profit-taking: A Doji candlestick pattern could also be a signal that traders are taking profits after a long bullish or bearish trend. The indecision and standoff between buyers and sellers suggest that the market may be at a turning point.
Market psychology: The psychology behind the Doji candlestick pattern can also be explained by the emotions of traders in the market. Fear and greed are the two primary emotions that drive market movements. A Doji candlestick pattern could be a sign that traders are experiencing fear or uncertainty, leading to indecision in the market.
Overall, the psychology behind the Doji candlestick pattern suggests that the market is in a state of indecision or a balance of power between buyers and sellers. It could be a sign of a reversal or continuation of the current trend, or a signal that traders are taking profits after a long bullish or bearish run. The psychological interpretation of the Doji candlestick pattern can provide valuable insights into the state of the market and help traders make informed decisions.


You say that market is in a state of indecision. It also suggests that market can go to either side.
Agree that market can now go to either side and will not be in a state of sideways.
Fine. But what is your tip for traders/Investors ? What should they do , when there is Doji candle formation? Buy/Sell/No action at all